6 minute read time
A closer look at the latest data from the commercial property market.
Commercial property returns
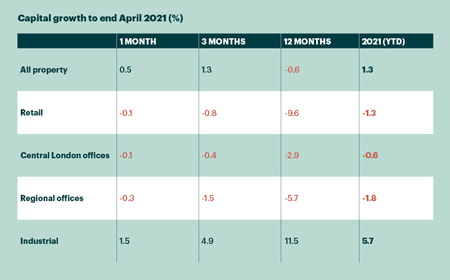
- Investment research firm MSCI reports that, on average, commercial property values rose by 0.5% in March and are up by 1.3% so far this year. However, that average continues to mask the contrast between exceptionally strong value growth in the industrial sector, and weakness elsewhere.
- Industrial values increased by a further 1.5% in April and are up by 5.7% in the year to date. Capital growth has been strong for both logistics assets and standard industrial assets across all regions. Rental growth has typically been stronger in the South East.
- Retail formats continue to diverge, with an 8.3% year-to-date decline in shopping centre values, contrasting with 2.4% growth for supermarkets. Retail Warehouse values have stabilised this year, with no further declines across any regions, and emerging growth in the South East. Solus units, with lower exposure to fashion, have outperformed parks.
- Office capital values in most regions have drifted down steadily over the past year, most notably the Midlands and Wales (-9.1%) and the inner South East (broadly the M25 markets: -8.7%). Rental values have been comparatively resilient, with value loss being driven by yield shift.
Capital growth to end of April 2021 (%)
Source: MSCI
Investment market activity
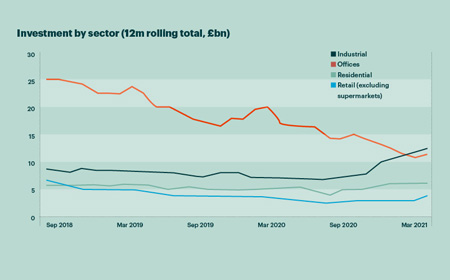
- A total of £2.9bn of investment deals transacted in April, representing the slowest month since last August, yet still more than double the volume reached last April, during the first lockdown.
- For the first month in a long time, the largest deal to complete was in the retail sector. Brookfield acquired a portfolio of seven retail parks from Hammerson for £330m (8.6% yield). The portfolio was initially sold to Orion Capital Partners for £400m in February 2020, but the buyers subsequently pulled out, forfeiting a £20m deposit.
- Many funds are seeking to reduce their weightings to retail, and the retail parks sector is providing a useful source of liquidity. British Land re-entered the market by buying the A1 Retail Park from the Aberdeen UK Property Fund for £49m (8.5% yield), while M&G sold Riverside Retail Park in Northampton to Melford Capital for £55m.
- • The life sciences sector has grown dramatically in profile over the past year, and a joint venture between Harrison Street and Trinity Investment Management will become one of the biggest operators in the UK via its £120m purchase of the BioCity Group. The four science parks acquired will take their combined portfolio to 2.6 million square feet.
- The logistics sector continues to attract demand from a range of investors, with a further £500m trading in April. Aberdeen Standard is forward-purchasing a Next distribution centre with a 23-year CPI-linked lease for £110m, and acquiring a new shed let to Amazon for 20 years for £100m. The purchase prices represent net initial yields of 3.5% and 3% respectively.
Investment by sector (12m rolling total, £bn)
Source: Property Data
Market yields
- Knight Frank sees little respite for the shopping centre sector, with sentiment remaining negative across all scheme types. It considers that benchmark yields for regional schemes – which include some of the top centres in the country – have moved out by a further 50 basis points (bp), to 8.5%. This marks an outward shift of 200bp over the past 12 months alone.
- In contrast, sentiment for retail warehouses has become decidedly more positive in recent months. Knight Frank perceives that benchmark yields have moved in 25bp for prime and secondary bulky parks, and for secondary Open A1 parks. The latter have seen yields compress by 75bp since March, and now only offer a 100bp margin over prime.
- Sentiment for logistics assets has remained positive throughout the pandemic, and the benchmark yield for prime warehousing (20 years/fixed uplifts) hardened further to 3.5%, illustrated by recent deals from Aberdeen Standard. Traditional estates are also in demand; the regional prime yield has come in to 4.25%, below pre-pandemic levels.
- Despite uncertainty around changing working practices, investor demand for Central London remains strong, and Knight Frank considers that prime City yields have hardened by 25bp to 4%, in line with their level before the onset of the pandemic. In contrast, sentiment for South East offices without long income is negative, with prime yields moving out to 6.5%.
Auctions
- Allsop’s commercial auction in May raised £63m from 93 sales. A total of 18 lots were sold at prices in excess of £1m, including three shopping centres in Kidderminster, Huddersfield and Widnes, which sold for a combined £7.4m.
- The highest price was achieved by the Swan Centre in Kidderminster, which sold for £3.77m, against a guide price of £2.75m – £3m. The purchase price represents an initial yield of around 20%, but less than half the income is secured beyond 2022. Elsewhere, the highest prices were achieved by lots with residential angles in London and the South East.
Market forecasts
- Some economists have expressed concern that inflation will rise sharply as rapid demand growth comes up against reduced capacity following the pandemic. Independent forecaster PMA has modelled a scenario under which strong growth is accompanied by higher inflation.
- Under this scenario it assumes that GDP rises by 15% by the end of 2023, and that this drives an increase in CPI to a 12-year high of 3.3%. PPI, the index for producer output prices, would peak at a 14-year high of 4.9% next year, while the 10-year gilt yield and five-year swap rate would more than double from current levels by 2023.
- PMA also predicts that the tail wind from stronger economic growth would drive an extra 1% – 2% per annum rental growth in the office, industrial and residential sectors, relative to their base-case scenario. In contrast, retail rental values would continue to be dominated by structural factors, with only a very marginal benefit from higher growth.
- Despite higher market interest rates under the inflationary growth scenario, PMA predicts that property yields would still compress in the office and industrial sectors, contributing to extra capital growth of 1% per annum and 3% per annum, relative to the base-case scenario. The benefit for retail would be far smaller and outweighed by structural factors.
This document has been prepared by National Westminster Bank Plc or an affiliated entity (“NatWest”) exclusively for internal consideration by the recipient (the “Recipient” or “you”) for information purposes only. This document is incomplete without reference to, and should be viewed solely in conjunction with, any oral briefing provided by NatWest. NatWest and its affiliates, connected companies, employees or clients may have an interest in financial instruments of the type described in this document and/or in related financial instruments. Such interests may include dealing in, trading, holding or acting as market-maker in such instruments and may include providing banking, credit and other financial services to any company or issuer of securities or financial instruments referred to herein. NatWest is not and shall not be obliged to update or correct any information contained in this document. This document is provided for discussion purposes only and its content should not be treated as advice of any kind. This document does not constitute an offer or invitation to enter into any engagement or transaction or an offer or invitation for the sale, purchase, exchange or transfer of any securities or a recommendation to enter into any transaction, and is not intended to form the basis of any investment decision. This material does not take into account the particular investment objectives, financial conditions, or needs of individual clients. NatWest will not act and has not acted as your legal, tax, regulatory, accounting or investment adviser; nor does NatWest owe any fiduciary duties to you in connection with this, and/or any related transaction and no reliance may be placed on NatWest for investment advice or recommendations of any sort. Neither this document nor our analyses are, nor purport to be, appraisals or valuations of the assets, securities or business(es) of the Recipient or any transaction counterparty. NatWest makes no representation, warranty, undertaking or assurance of any kind (express or implied) with respect to the adequacy, accuracy, completeness or reasonableness of this document, and disclaims all liability for any use you, your affiliates, connected companies, employees, or your advisers make of it. Any views expressed in this document (including statements or forecasts) constitute the judgment of NatWest as of the date given and are subject to change without notice. NatWest does not undertake to update this document or determine the accuracy or reasonableness of information or assumptions contained herein. NatWest accepts no liability whatsoever for any direct, indirect or consequential losses (in contract, tort or otherwise) arising from the use of this material or reliance on the information contained herein. However, this shall not restrict, exclude or limit any duty or liability to any person under any applicable laws or regulations of any jurisdiction which may not be lawfully disclaimed. The information in this document is confidential and proprietary to NatWest and is intended for use only by you and should not be reproduced, distributed or disclosed (in whole or in part) to any other person without our prior written consent. National Westminster Bank Plc. Registered in England & Wales No. 929027. Registered Office: 250 Bishopsgate, London EC2M 4AA. National Westminster Bank Plc is authorised by the Prudential Regulation Authority, and regulated by the Financial Conduct Authority and the Prudential Regulation Authority.