4 minute read time
A closer look at the latest data from the commercial property market.
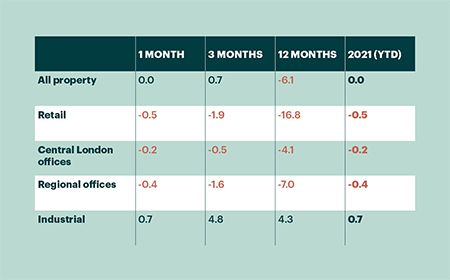
Investment research firm MSCI reports that average capital values were flat in January. But, continuing the established trend from last year, the underlying story is very different. Retail values fell by a further 0.5%, while office values also drifted down, yet in stark contrast industrial values grew by 0.7%.
Capital values in the industrial sector have now risen by almost 5% in the past three months. Rental values are up by 1.1% over that period, with most of the growth delivered by yield compression. Growth over the three months has been strongest in London (7.8%) but has been robustly positive across all regions.
Performance across retail formats is becoming increasingly divergent. Shopping centre values continue to decline rapidly; down by 2.8% in January. Over three months, shopping centres are down by 6.5%, while retail warehouse values may have started to stabilise (-0.6%) and supermarket values have grown steadily (+1.4%).
The office sector has seen values drift gradually downwards, with the South East markets most affected so far, and central London proving relatively resilient. This relative performance has been largely yield driven, with rental values broadly flat across most markets to date.
Capital growth to end January 2021 (%)
Source: MSCI
Investment market activity
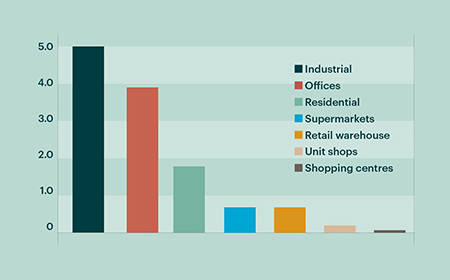
- January saw £2bn transacted, approximately 20% down on the same month last year, and barely half of the five-year average for the month. The market continues to be driven by the industrial and residential sectors, with the traditionally dominant retail and office sectors only accounting for 20% of the total.
- US investment manager Partners Group was the latest overseas investor to acquire an industrial portfolio, investing £253m in 27 multi-let estates across the UK. Vendor Paloma Capital will stay on as co-investor and operating partner as the platform expands.
- The residential sector remains very active, with a wide variety of investors active in different niches. Goldman Sachs and Pitmore acquired 918 units around Manchester and Liverpool for £150m. Home REIT paid £70m for 798 beds across 171 assets, let on Consumer Prices Index-linked leases to various homeless charities and a housing association.
- Canadian institutional investor AIMCo and build-to-rent (BTR) specialist Ridgeback Group have invested £100m into a 358-unit scheme in Manchester. Grainger forward-funded a 231-unit scheme in Bristol for £63m. L&G committed £57m into 245 units across two schemes in Leeds.
- Although supermarkets continue to take a large proportion of investment into retail, there are some signs of renewed interest in retail warehouses. Columbia Threadneedle, M7 and Colliers all acquired assets in January, contributing to a total of £683m invested since November, the strongest three-month period since 2018.
Investment by sector (3 months to January 2021, £bn)
Source: Property Data
Market yields
- Knight Frank report that the bifurcation of commercial property markets that characterised 2020 continues, with benchmark yields for discretionary retail softening further, while supermarket and industrial yields move in the opposite direction.
- The shopping centre market is marked by very low levels of liquidity and Knight Frank considers that all yields remain on an outward trajectory. The real estate consultancy estimates that the benchmark yield for sub-regional shopping centres has moved out by a further 50 basis points (bp) to 8.75%; 150bp up year on year. In contrast, supermarket yields have hardened further to 3.75%.
- The industrial sector is attracting a huge weight of capital, which is putting further downward pressure on yields. With prime yields at record lows, investors are once again considering more secondary stock. Benchmark secondary distribution yields returned to pre-pandemic lows of 5.0%, while secondary industrial estate yields have reached new lows of 5.75%.
- In the office sector, robust demand from overseas investors has held down prime central London yields despite the backdrop of low physical occupancy. However, South East markets are starting to look a little soft, with yields for multi-let assets (five-year income) drifting out by 25bp to 6.25% and 6.75% for town centre and business parks respectively.
Auctions
- Allsop’s first commercial auction of the year in February raised £30m from the sale of 42 lots, achieving an overall success rate of 80%. Assets with secure income remain in strong demand, with a portfolio of Santander branches sold at an average yield of 5%. While income only runs to 2025, values were supported by residential development potential.
- At the other end of the risk spectrum, the West Orchards Shopping Centre in Coventry sold for £4.85m following a 12-month marketing process. The price reflects a notional initial yield of almost 50% but was anchored by Debenhams, which is now in liquidation.
Market forecasts
- Forecasts produced by CBRE in Q4 last year anticipate that the trends seen in the second half of 2020 will continue into 2021. The real estate services firm predicts further material declines in the retail sector, a slight softening of values for offices and ongoing robust growth for industrial assets.
- CBRE forecasts that retail values will fall by a further 12% in 2021 before starting to recover from 2022. In one change from recent trends, it expects retail units to take over from shopping centres as the worst performer, with shop values expected to fall by a further 17% this year.
- CBRE expects that office values will decline by an average of around 4% this year, taking the cumulative correction to around 8% to 10%. It expects that the decline will be driven by lower rental values, with market yields remaining broadly stable. It anticipates that London and the South East will return to growth in 2022, while other regions will stagnate.
- CBRE does not expect the bull market for industrial to come to an end any time soon, predicting a further 12% increase in capital values by the end of next year. It expects this to be driven by a combination of steady rental growth and hardening yields.
This document has been prepared by National Westminster Bank Plc or an affiliated entity (“NatWest”) exclusively for internal consideration by the recipient (the “Recipient” or “you”) for information purposes only. This document is incomplete without reference to, and should be viewed solely in conjunction with, any oral briefing provided by NatWest. NatWest and its affiliates, connected companies, employees or clients may have an interest in financial instruments of the type described in this document and/or in related financial instruments. Such interests may include dealing in, trading, holding or acting as market-maker in such instruments and may include providing banking, credit and other financial services to any company or issuer of securities or financial instruments referred to herein. NatWest is not and shall not be obliged to update or correct any information contained in this document. This document is provided for discussion purposes only and its content should not be treated as advice of any kind. This document does not constitute an offer or invitation to enter into any engagement or transaction or an offer or invitation for the sale, purchase, exchange or transfer of any securities or a recommendation to enter into any transaction, and is not intended to form the basis of any investment decision. This material does not take into account the particular investment objectives, financial conditions, or needs of individual clients. NatWest will not act and has not acted as your legal, tax, regulatory, accounting or investment adviser; nor does NatWest owe any fiduciary duties to you in connection with this, and/or any related transaction and no reliance may be placed on NatWest for investment advice or recommendations of any sort. Neither this document nor our analyses are, nor purport to be, appraisals or valuations of the assets, securities or business(es) of the Recipient or any transaction counterparty. NatWest makes no representation, warranty, undertaking or assurance of any kind (express or implied) with respect to the adequacy, accuracy, completeness or reasonableness of this document, and disclaims all liability for any use you, your affiliates, connected companies, employees, or your advisers make of it. Any views expressed in this document (including statements or forecasts) constitute the judgment of NatWest as of the date given and are subject to change without notice. NatWest does not undertake to update this document or determine the accuracy or reasonableness of information or assumptions contained herein. NatWest accepts no liability whatsoever for any direct, indirect or consequential losses (in contract, tort or otherwise) arising from the use of this material or reliance on the information contained herein. However, this shall not restrict, exclude or limit any duty or liability to any person under any applicable laws or regulations of any jurisdiction which may not be lawfully disclaimed. The information in this document is confidential and proprietary to NatWest and is intended for use only by you and should not be reproduced, distributed or disclosed (in whole or in part) to any other person without our prior written consent.
National Westminster Bank Plc. Registered in England & Wales No. 929027. Registered Office: 250 Bishopsgate, London EC2M 4AA. National Westminster Bank Plc is authorised by the Prudential Regulation Authority, and regulated by the Financial Conduct Authority and the Prudential Regulation Authority.